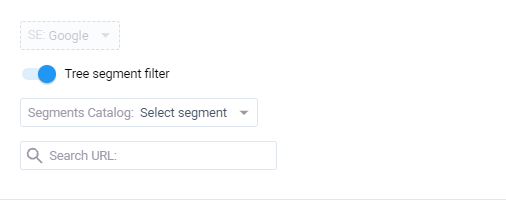
At the Visibility Dashboard page you may track visibility metrics and estimate potential growth for the whole website or groups of pages (URL groups) or groups of keywords (just select necessary ones from the Segment Catalog).
Below you see key metrics for selected segments for selected period.
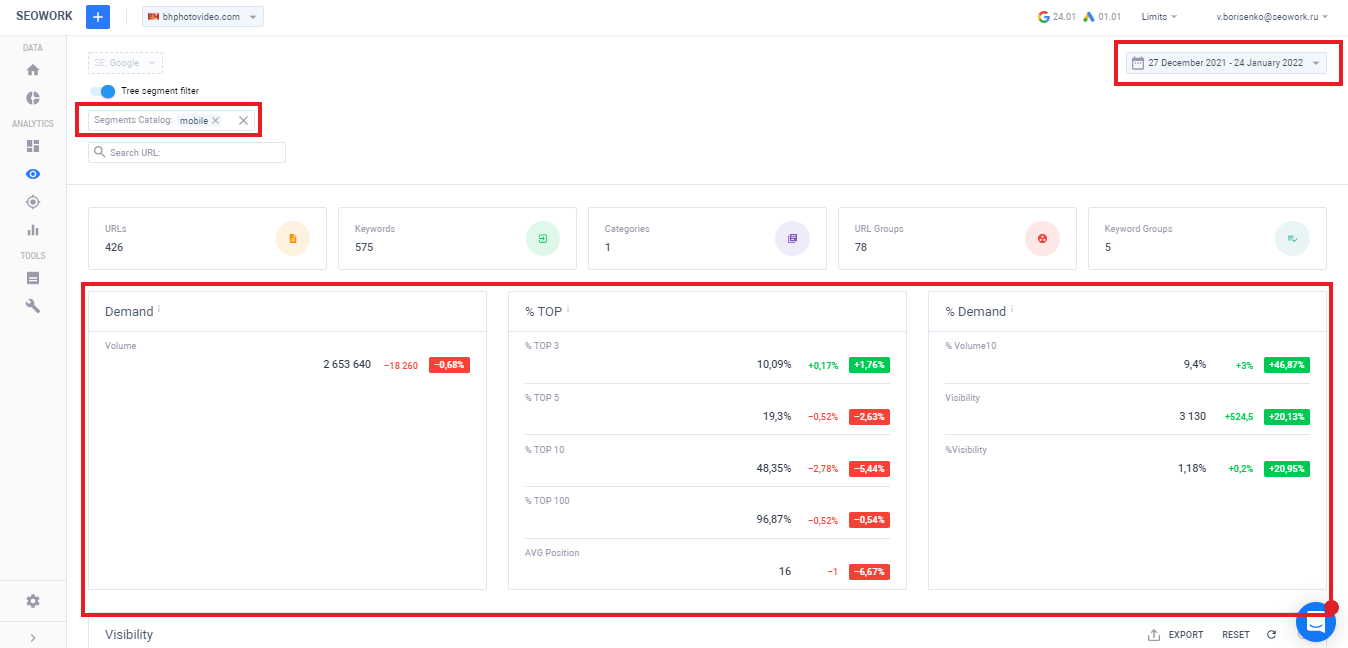
- Volume – the number of search queries for a specific keyword per month.
- % TOP3 / % TOP5 / % TOP10 / % TOP100 – these metrics show percentage of your keywords at first 3 / 5 / 10 and 100 positions in search.
- AVG Position means average position (keywords not in TOP100 counts as position #100).
- %Visibility is one of the most important metrics. It’s calculated as a share of your project search traffic in potential available traffic. Potential available traffic is traffic you would get if all pages referred to our keywords were at the first positions in search.
Our practice shows that a value of %Visibility more than 40% means the project is leader or close to.
To track all those metrics in progress you need to choose the exact period.
Tracking metrics in progress helps to understand your ranking, seasonality and opportunities for a growth.
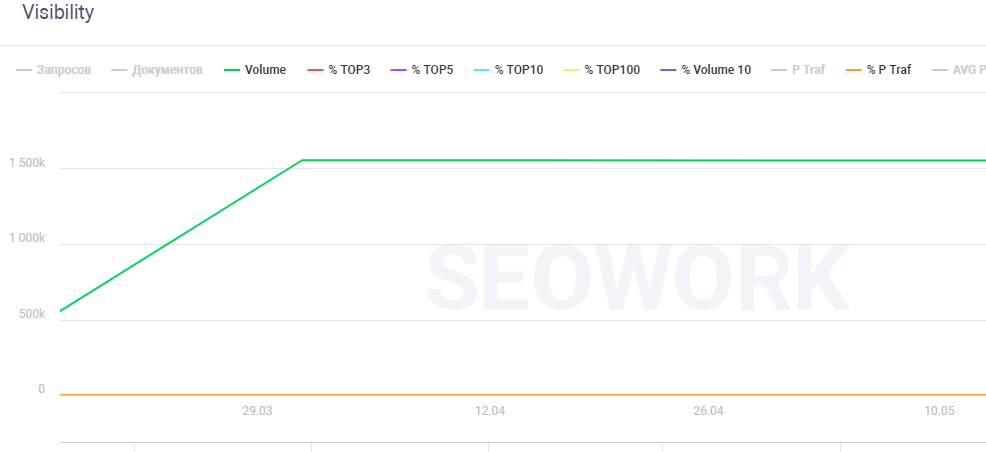
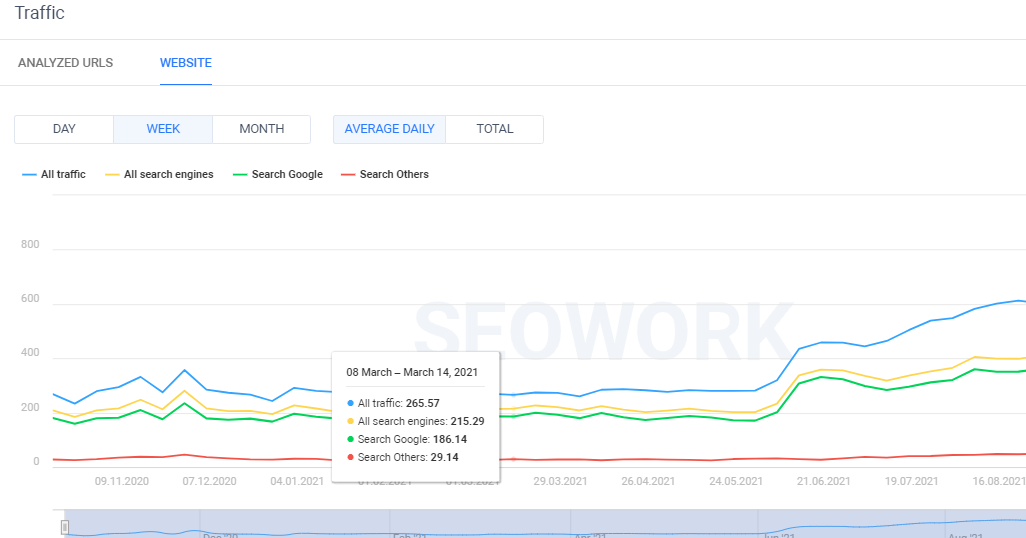
At the line chart below you may see search traffic dynamic by the sources and you may zoom it from month to days.