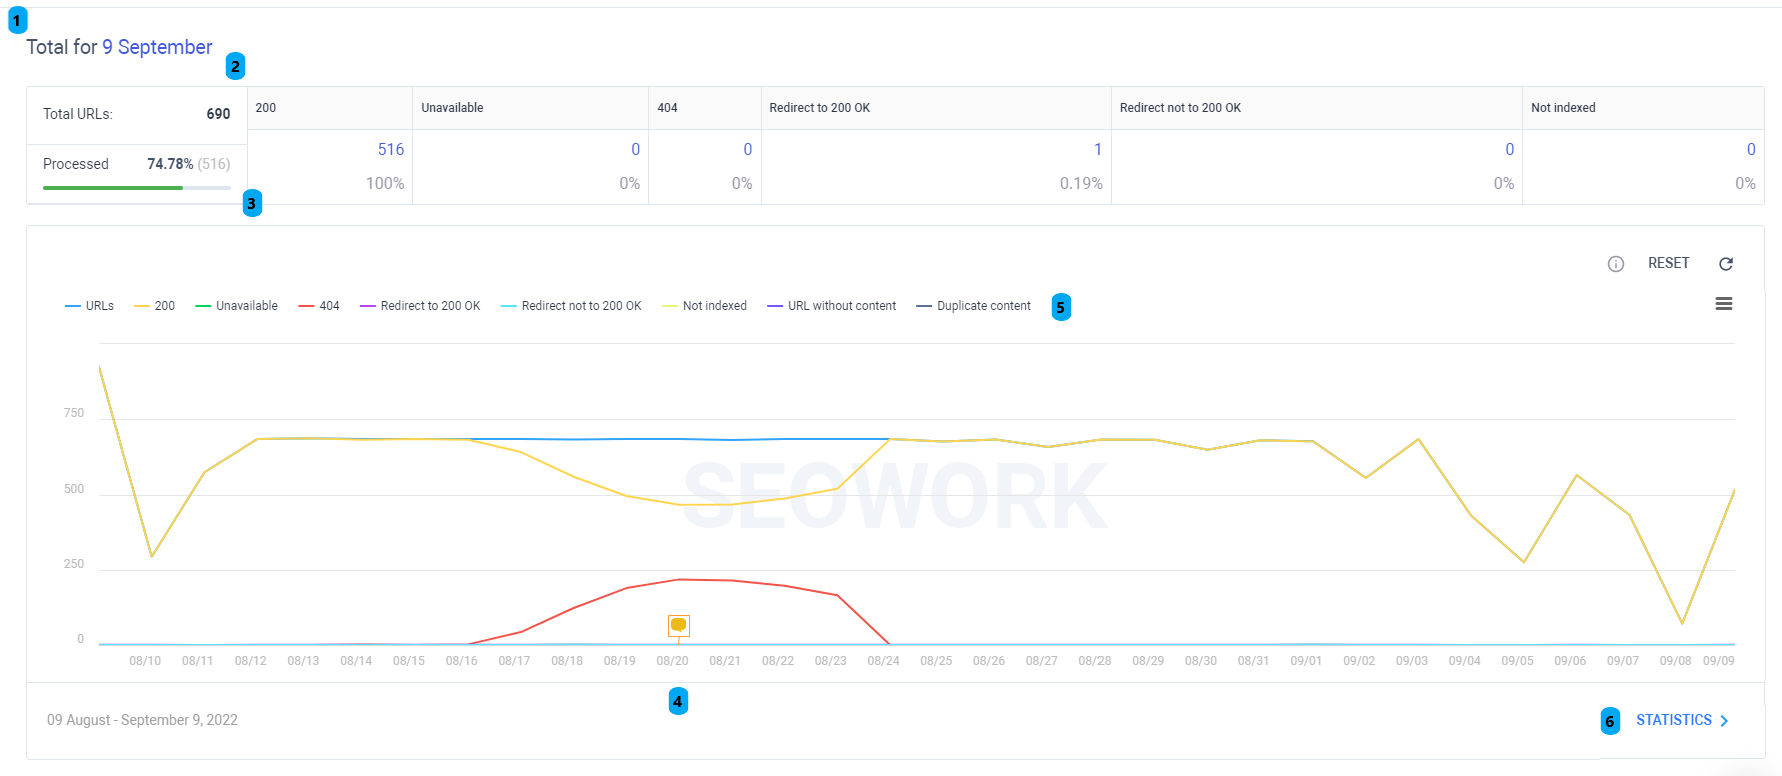
1.In Tech Monitor – Dashboard you can select a date to see the exact number of server response codes you are interested in. This will help you understand on which dates errors were observed and your project’s web server was unavailable. This will help identify mistakes made by your developer or hosting issues.
2.The table contains data on the total number of processed URLs, where 100% is all URLs loaded into the system, then there are columns depending on the web-server response codes:
- 200 OK
- 5xx
- 4xx
- 3xx to “200 OK”,
- 3xx to “not 200 OK”
- separate column for not indexed URLs
3.”Proccessed” bar shows the percentage of URLs SEOWORK parser was able to crawl
4. You may see the same yellow marks you saw on Visibility and Competitors Dashboards. Those would help you to understand whether web server issues are related to any implementations you made (and put the mark about them in the system)
5. There are 7 types of line you may see on Tech Monitor Dashboard:
- URLs – Total Number of URLs in the system
- 200 – Number of URLs with 200 OK web-server response code
- Unavailable – Number of URLs with 5xx web-server response code
- 404 – Number of URLs with 4xx web-server response code
- Redirect to 200 OK – Number of URLs with 3xx web-server response code, where final destination is document with “200 OK” web-server resposnse code.
- Redirect to “not 200 OK” – Number of URLs with 3xx web-server response code, where final destination is document with NOT “200 OK” web-server resposnse code.
- Not indexed – Number of URLs that are not in Google Search INdex
- URL without content –
- Duplicate Content
6. Statistics button will redirect you to the Tech Monitor – Statistcs panel, where you will find more descriptive analysis on web-server response codes of documents uploaded to SEOWORK.


