Any business, especially in ecommerce, invests a lot of time and money into creating a great website that will bring profit. In terms of business, there are two general metrics which help to measure a website’s success: search traffic and engagement.
There are many factors which can be modified on a website to affect the results: technical parameters, design, content, etc. How can you understand the impact of these factors, measure the progress, and find out what can be improved?
In the guide below, we provide a system of metrics which allows you to evaluate your progress in detail and become aware of what might be done to get more search traffic and boost the conversion rate.
– search traffic metrics
– user behavior metrics
– sales metrics
– tech SEO metrics
– the system of the metrics
We will also explore how they correlate with each other and how this knowledge can help you plan the next steps.
Visibility metrics
Visibility metrics allow you to evaluate the effectiveness of site ranking in search engines.
This group of metrics includes:
- Demand is frequency of search queries.
- Average ranking shows the average position of the site in search engines.
- %TOP10 shows the ratio between the percentage of keywords related to pages in the TOP, and the total amount of requests.
- %Visibility shows the percentage of the maximum possible traffic which the site could get if each of its pages was in the TOP.
Examples:
A Demand of 5,127,460 means that users searched for those particular keywords in search engines more than 5M times – that’s a lot!
A Ranking of 12 shows that your website was around the 12th position in the search engine for a particular period – you have potential for growth.
A %TOP10 of 76.2% means that the majority (76.2%) of your keywords work and are related to the pages in the TOP10.
A %Visibility of 45.55% is a great result that shows you get more than 40% of the possible accessible search traffic for your keywords.
Search traffic metrics
Traffic metrics allow you to evaluate your site’s effectiveness in terms of the number of site visitors.
- Number of sessions.
- Number of unique visitors (usually the value of this metric is lower than the number of sessions because one user may visit the website more than once).
- Number of new visitors
- Retention rate is a number of visitors who came back for another purchase divided by number of visitors who made a purchase over a particular period.
Examples:
60,880 sessions means user visits per month.
34,554 of unique visitors means that almost every user visited the website twice on average.
10,287 new visitors means new visitors per month.
Retention rate of 63.2% means that more than half of the buyers returned for another purchase.
User behavior metrics
User behavior metrics help you evaluate the quality of traffic attracted to the site and users’ interaction with the content.
- Bounce rate is single-page sessions divided by all sessions, or the percentage of all sessions on your site in which users viewed only one page.
- Average session duration shows the average amount of time spent per session on your website.
- Average depth of view per session (the average number of page views per session).
- Engagement shows level of interaction by followers from content created by a user – the number of visitors’ interaction with content divided by the number of visitors.
Sales metrics
Sales metrics help to evaluate the site’s effectiveness in terms of conversion actions – sales and revenues.
- Transaction means number of purchases.
- Conversion Rate (CR) is the number of conversions divided by the total number of visitors on a website.
- Revenue shows revenue from all purchases during the period.
Examples:
1728 transactions mean 1728 purchases.
5% CR means that 5 of 100 users make purchases.
$264K revenue shows your revenue for the pediod
Tech SEO metrics
These metrics help to assess the level of technical availability of the site for users and can be measured by different SEO-tools.
- Indexed pages are number of web pages indexed by search engines.
- Page load speed
- Adaptive design
Examples:
94% indexed pages means there are a few pages that are inaccessible to search, and you need to fix it to stop losing search traffic.
3 sec page load speed needs your attention, as a faster load speed (under two seconds) could improve engagement and SEO results.
The system of the metrics
Now let’s explore how each group of metrics correlates with other groups and how together they form a structure.
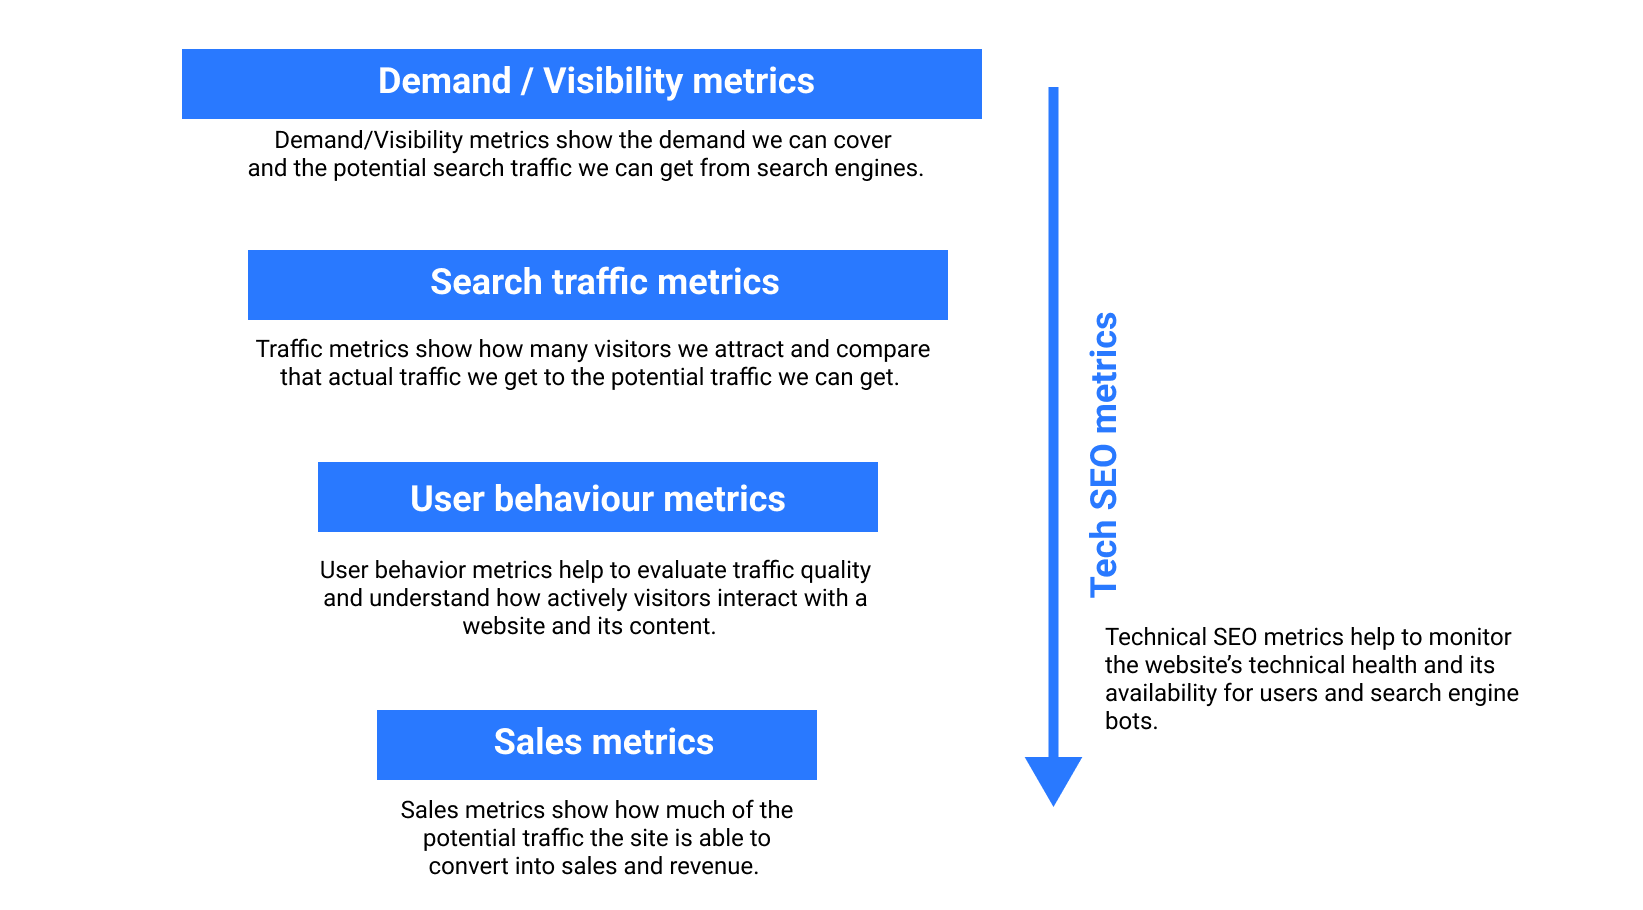
The user’s path from visibility to conversion can be described in terms of a sales funnel, where each subsequent step depends on the effectiveness of the previous stage.
At the same time, a block of technical SEO metrics affects each stage of the funnel. For example, if a site has technical issues, this will have a negative impact on each group of metrics along the funnel.

A system of website performance metrics
Analysis of demand/visibility metrics help to understand on what positions which pages are shown and prioritize pages for SEO. Evaluating the relevance of the site to users’ search queries and, as a result, improving positions. Behavioral metrics evaluate the relevance and quality of page content. Finally, the sales metrics measure the commercial results and help to evaluate ROI of SEO
***************
We hope this guide was useful for you and helped to make your website performance measurable and more clear. You can use the approach above either for your whole website, or part of it; for example, you can compare the efficiency of webpages for particular product categories such as electronics, clothes, beauty, etc.
And remember, you can always simplify the process of gathering and analyzing all that data with the SEOWORK analytics platform.
It would be great if you told us about the metrics system you use to measure your SEO. Your feedback will be much appreciated!


