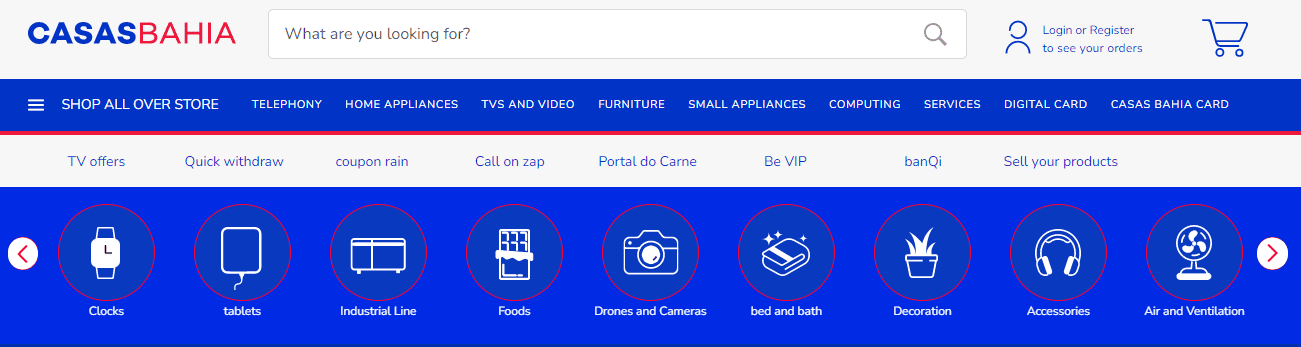
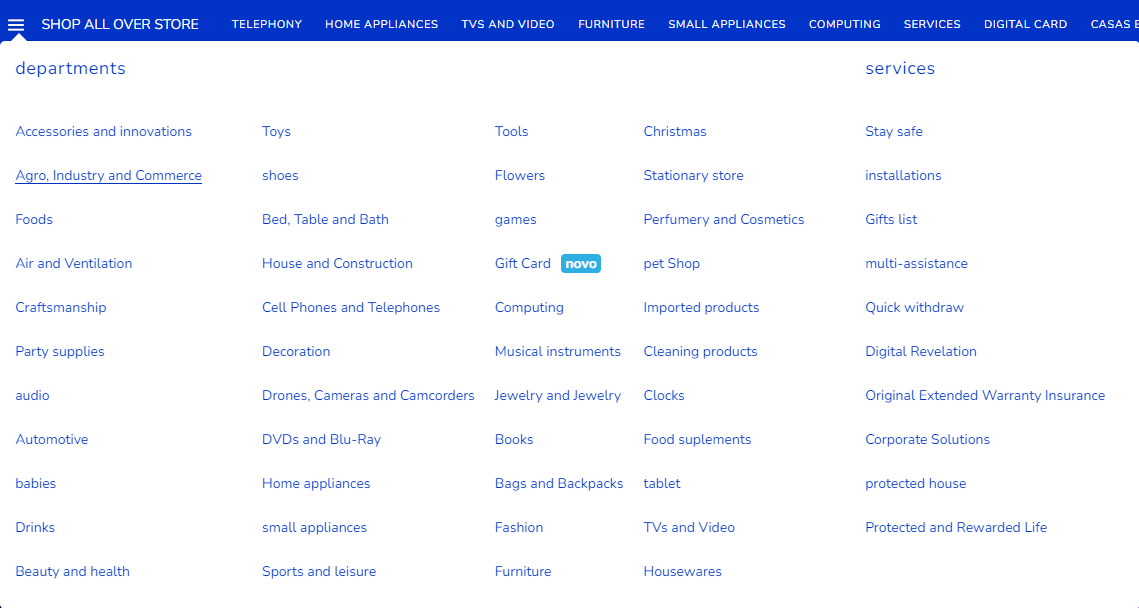
eCommerce has a number of characteristic features in SEO, which are unique to this direction. So, for large online retailers, which we specialize in, it is important to cluster by category of goods with which the client works. You can often see these categories in the header of an online store, in a drop-down menu, or in a hamburger menu.
In this particular case, we’ll focus on a Brazilian eCommerce project and look at its nesting structure, demand, visibility, and basic workflow.
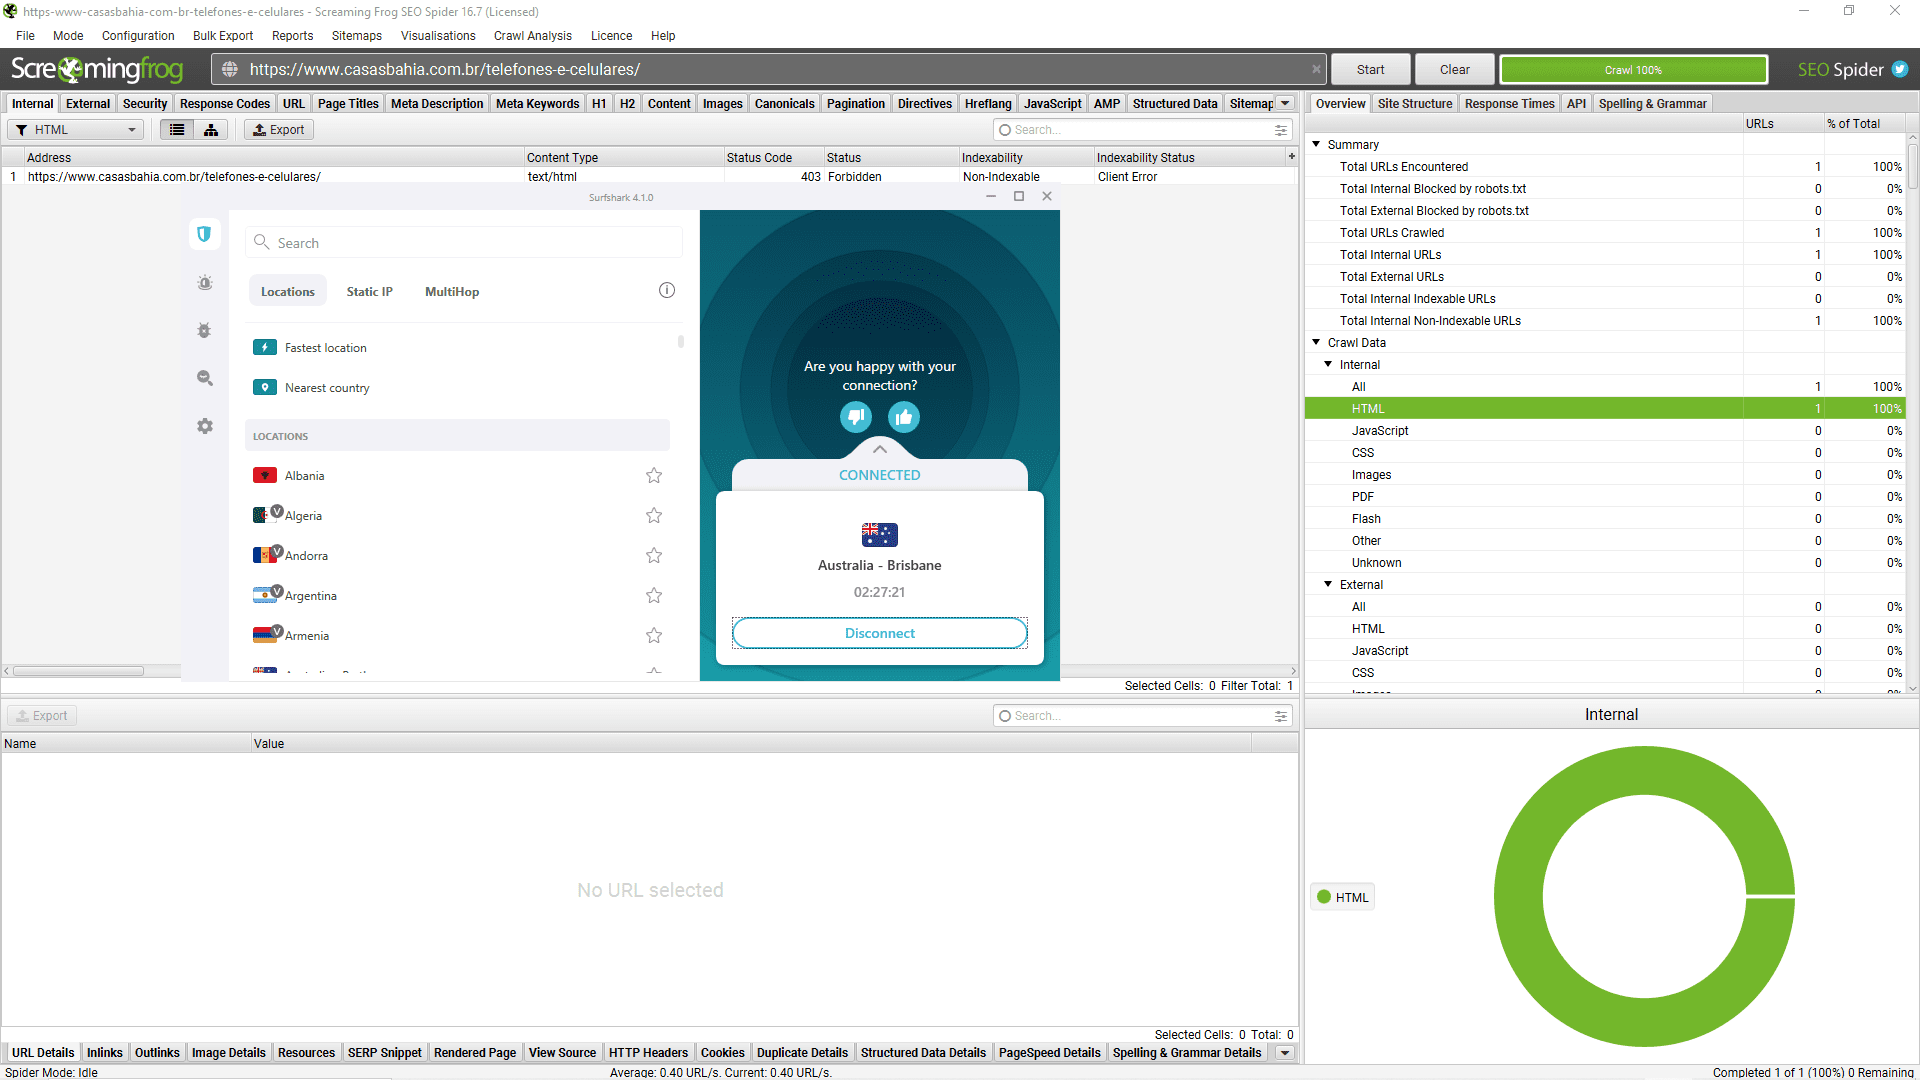
In order to analyze categories by nesting levels SEOWORK analytics needs to first spar the structure. Screaming Frog with its multithreaded parsing feature helps us in this.
although even at this stage there can be problems: blocking by GEO of the outgoing request at the site web server level, blocking due to the number of requests to the server, and technical errors in the project itself.
Nevertheless, after generating a list of urls and clustering them, we can work through the key phrases we want each of the client’s project pages to rank for. To analyze the project, at least one keyword should be planted on each URL in the system to further take positions in SERPs for this URL for this query.
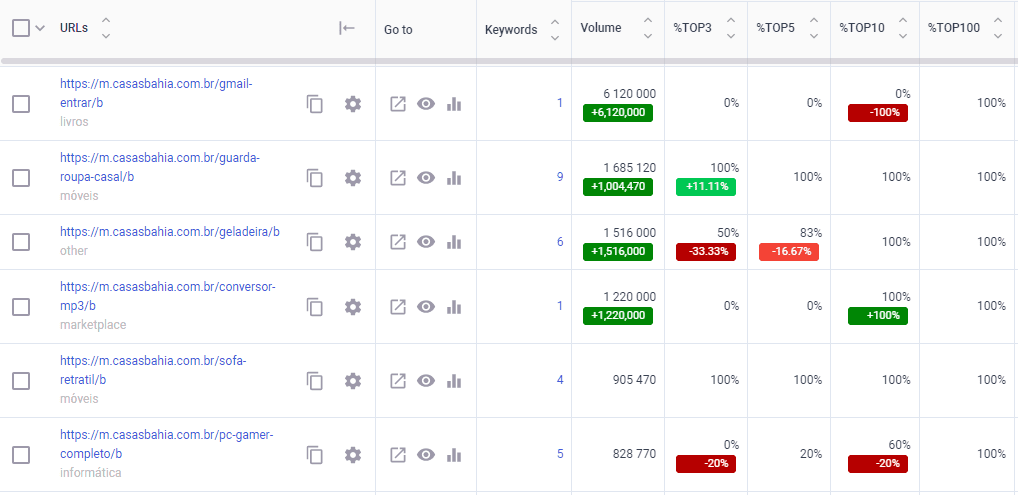
The above snapshot is an example of several URLs belonging to different product categories and ranking for one or more queries tracked in the system. Since we are focused on increasing the conversion of the client, we focus primarily on the commercial queries, excluding the infothematics and navigational queries.
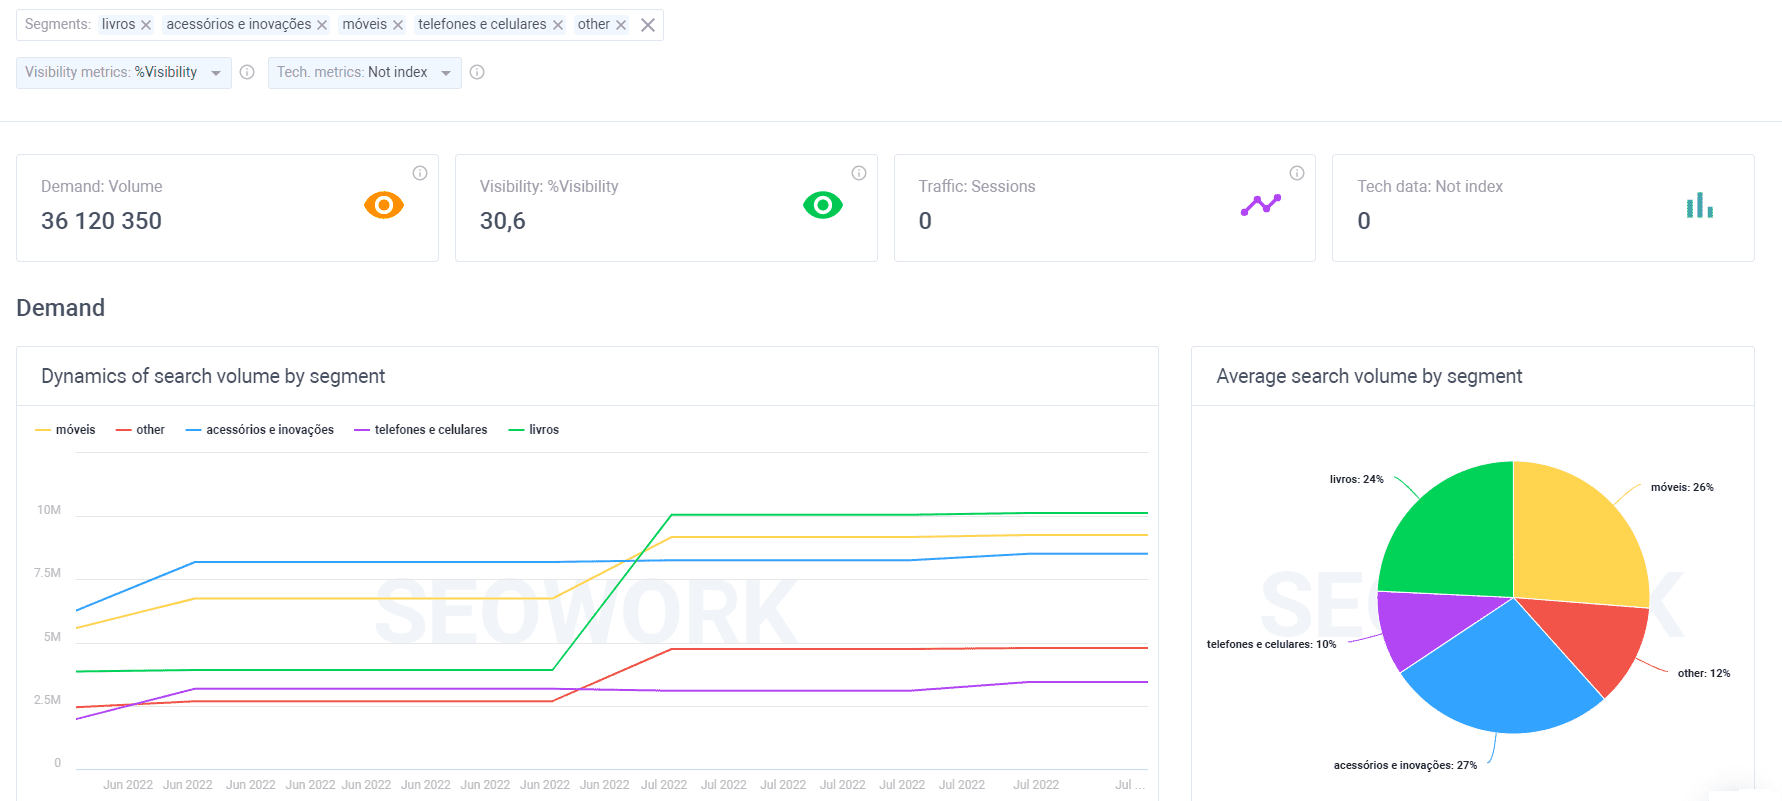
Now back to the main topic, categories. After segmenting the site into categories and entering them into SEOWORK, dashboards are automatically generated, which allow us to determine the growth points of the project in a matter of moments. So, the main categories in terms of demand are “acessórios e inovações”, “móveis” and “livros.
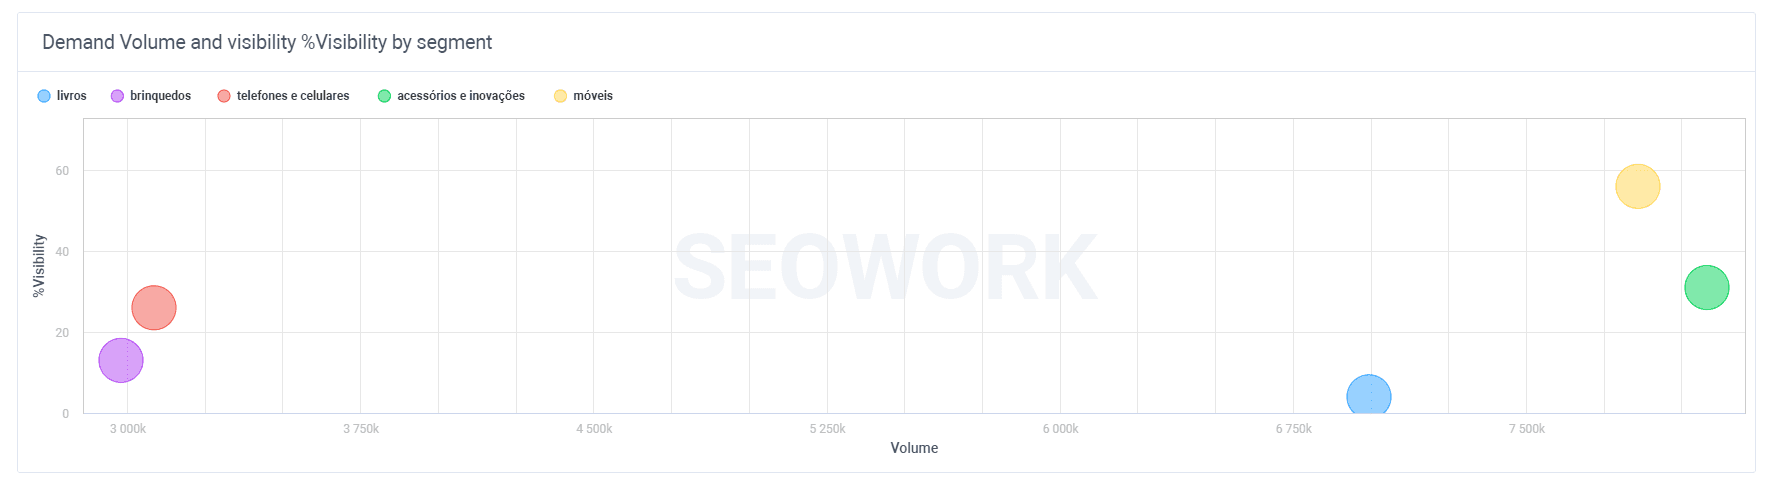
The most revealing when analyzing a project will be the Demand Visibility bubble chart. It gives a visual representation of which search queries located in which categories have the highest demand but the lowest visibility in the Google search engine. In this case it is the category “livros”, on the elaboration of which the SEO specialist should focus his attention.
In the section above, we talked about the analytics “inside” the project. But it is certainly important to understand not only the position of each cluster in the search engine in general, but also the position of categories in relation to major competitors. So a regular survey of search results by the pool of queries collected in our analytics platform allows you to observe in real time which of the competitors have grown in which areas. This simplifies both the analysis of the niche and the competitors in the niche, as well as reduces the time for post-adaptive analytics.