Hi, I’m Vlad, Senior SEO Analyst at SEOWORK, the SEO and BI data analytics platform. Today we are going to talk about A/B (bucket) testing or so-called split tests, but first, let me introduce myself.
Half a year ago I was invited to join SEOWORK team to help in-house teams from major eCommerce brands, marketplaces, and online retailers around the globe grow their business, and even though I’ve worked with marketplaces before, the data-driven approach at SEOWORK made me feel like I was in paradise.
Introduction
Today I am going to explain to you some basic principles of how A/B testing is performed, how our platform can help you with it, and what results you can gain from it.
This is how it all usually starts. A product manager or someone who represents a business comes up to you with the idea of implementing a new feature on their website.
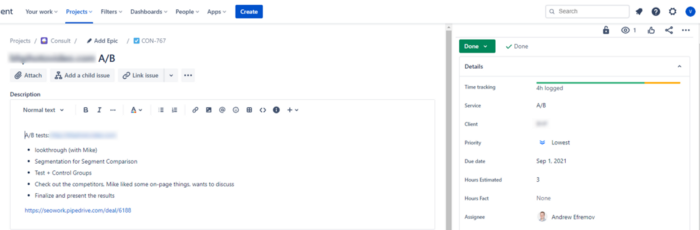
If you are a part of an in-house team or have had such experience, then what you see below won’t be a surprise for you. Here’s what it looks like for me. I got a message from my team lead Andrew, who talked with our client’s product manager, got the description of a task in Jira, and had a Zoom call with that product manager later.

The ideas clients come up with are always different and vary a lot, depending on the niche or sphere they work in. For marketplaces and e-commerce projects, it’s usually something related to Product Listing Pages (PLPs) or Product Card Pages (PCPs). For example, the more photos of a product on the page you have, the higher your conversion is, and the higher Google ranks your website pages for relevant keywords and search queries.
In this case, the client wanted us to analyze how product photos made by customers on a product page affected its page ranking, and add some external links to trusted resources on some product pages to see what happened. He had seen that feature on several competitors’ pages. That’s also a common story. After you, as an in-house SEO team lead, have analyzed the competitors and noticed that all the ones from the SERP TOP10 have something that you don’t have, you’ll probably want to try it out. We can compare two groups of pages with and without a feature you want to test.
Starting a project
After both parties concur with the idea, it’s time to make a plan, which is actually not that complicated:
- We create a group of pages, or several groups if needed.
- We implement the new features.
- We wait for them to get indexed by Google.
- After that, we can easily analyze the results and provide our team lead with the numbers on how all the implementations affected the ranking.
That’s how we know if we should or shouldn’t scale up the experiment in the future.
- The set of webpages we work on is called the test group.
- All the pages of the same type that the test group should be compared with are called the control group.
- A set of keywords or URLs joined together according to a common feature (presence/absence of a toponym in a search query or presence/absence of a specific HTML block on the pages) is called a segment.
In the first case that I’ll tell you about, the idea was to evaluate how a block with customers’ photos on a product card page affected its ranking in the Google search engine. That’s what we discussed with our client’s product manager.
As soon as the task to analyze product card pages and run A/B tests on them became clear, we started working on it.
And how do you analyze pages? It’s not that difficult. I would say that with the SEOWORK platform it’s actually quite easy. You just create the segments (sets of web pages or keywords) you need and compare the metrics needed within a certain period of time. Luckily, all the metrics such as position in SERP are uploaded to projects on the platform automatically. If you don’t use the SEOWORK platform, you’ll have to calculate all the metrics and build graphs in Google Sheets or something like that.
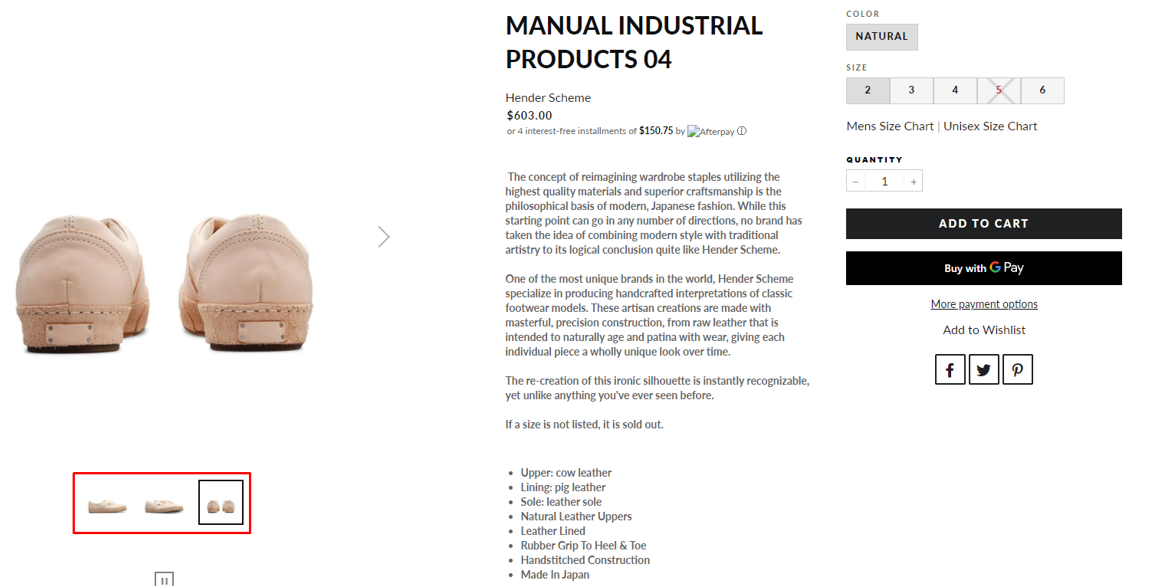
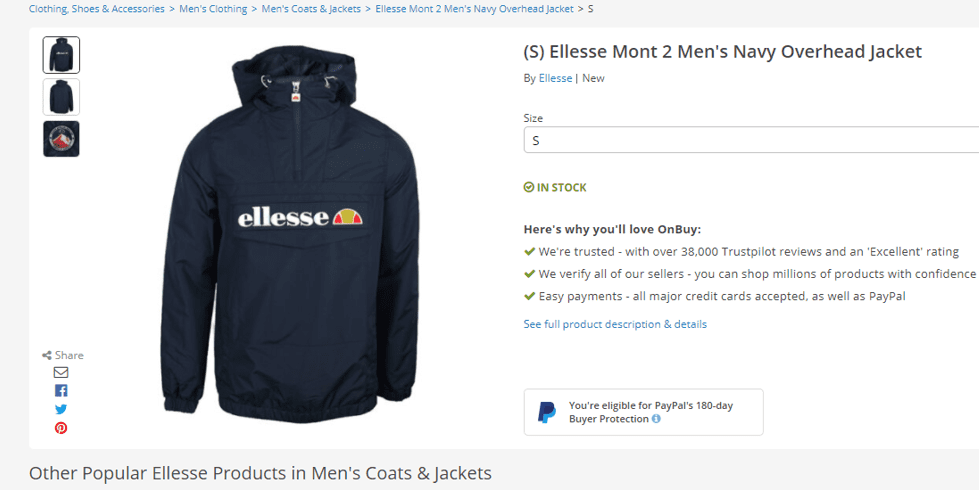
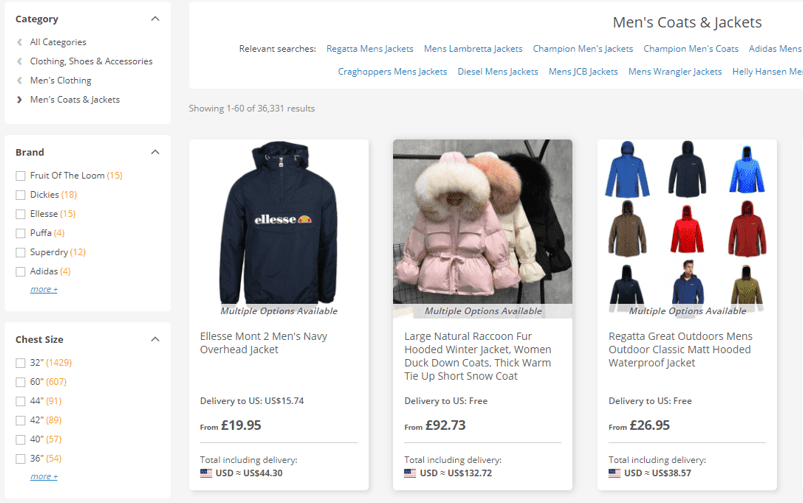
So, what about the client and their product pages? Here are two examples of product cards from the US-based online store which is our case study for today. It sells various laptops, smartphones, keyboards, cameras, and other related stuff, like the mouse and the chroma-key backdrop in the pictures below.


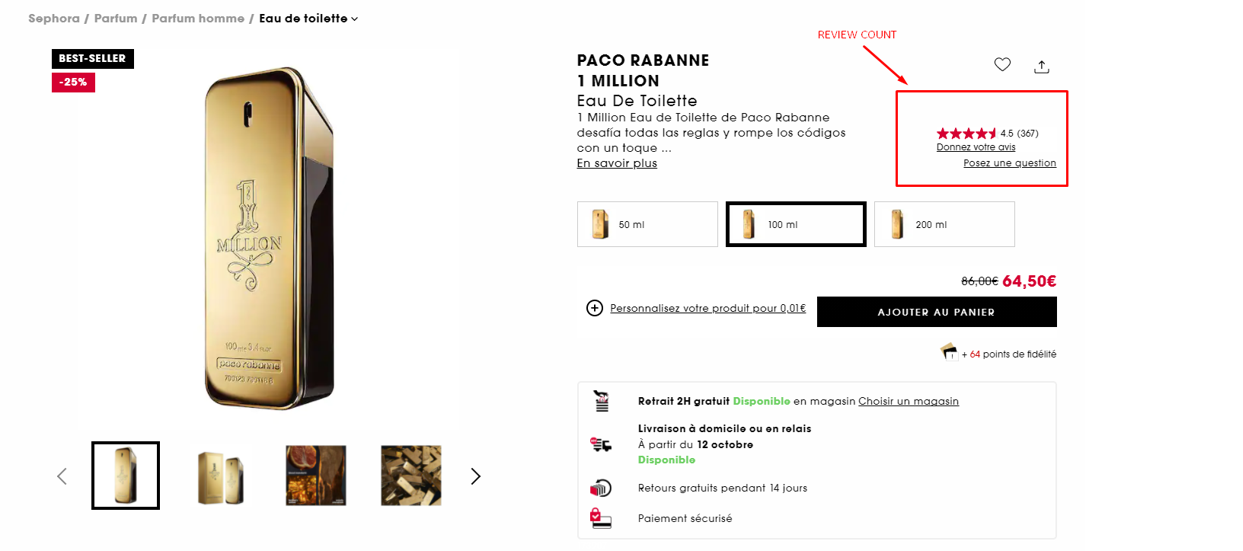
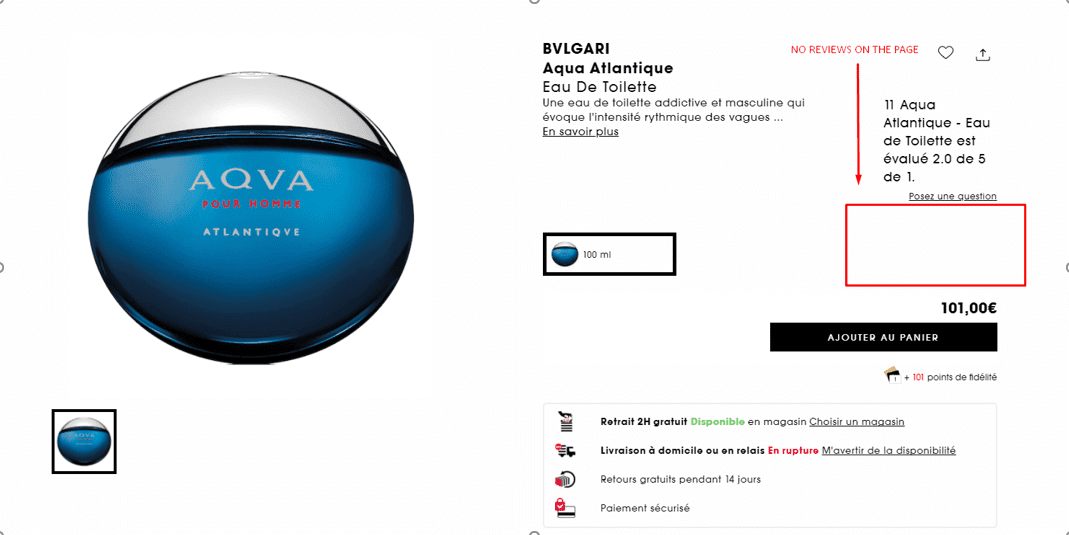
Depending on the task, you may have to analyze different blocks, such as:
- rating,
- review count,
- price presence,
- availability in stock,
- E-A-T blocks,
- video reviews,
- and 3D product images.
But in this case, we’re talking about the customer photo gallery block. For product card page analysis, we took two different groups. The first one, with the mouse, just contains vendor photos, while the second one, with the chroma-key backdrop, features photos provided by customers.
Process
Data Parsing
For this task I parsed over 8 thousand URLs in Screaming Frog with custom extraction of the HTML blocks we needed, and uploaded them into our platform project.
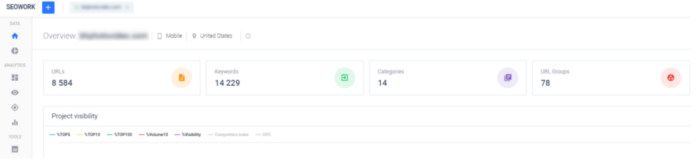
Remember that the more pages taken into account, the more representative the results are. As soon as we know the keywords these pages are ranked for, we can measure the percentage of the pages in %TOP3, %TOP5, %TOP10, and %TOP100, and our positions in the top 10 for total demand for the products are analyzed.
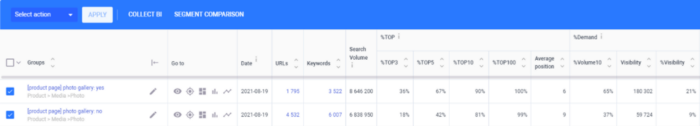
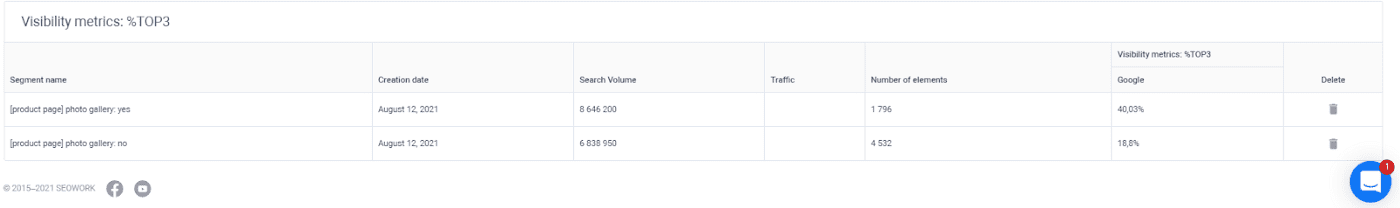
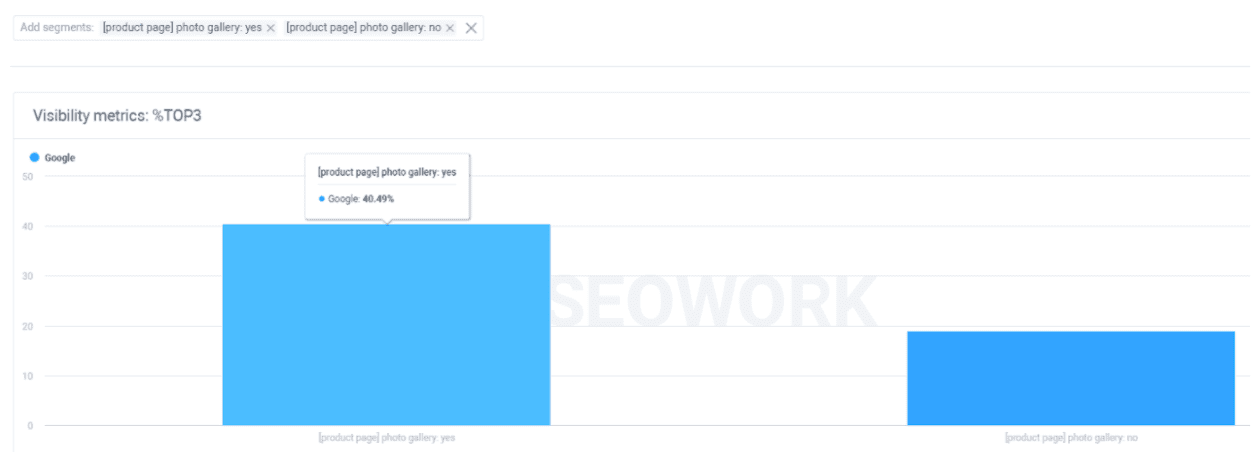
In just two minutes, we get a bar chart with numbers showing that the pages with customers’ photos are ranked higher by Google than the others. As you may notice, there’s not much of a difference if we compare the presence of the product pages in TOP10.
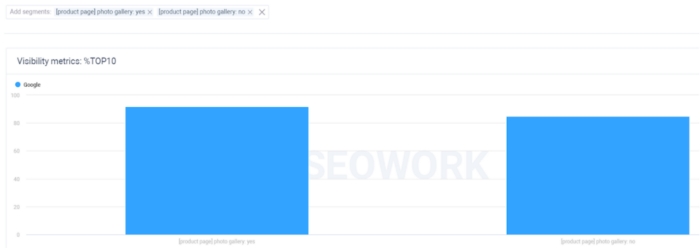
But if we dig deeper into TOP3, the bar chart on the left, the difference is significant, and that’s a great insight for us and our client.
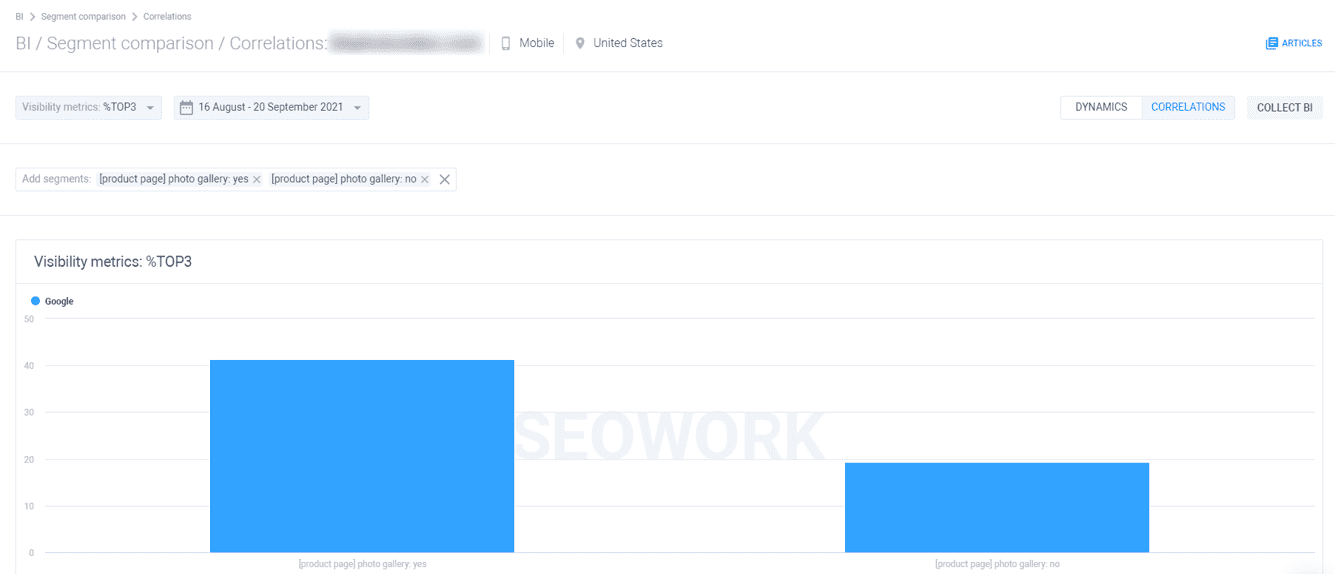
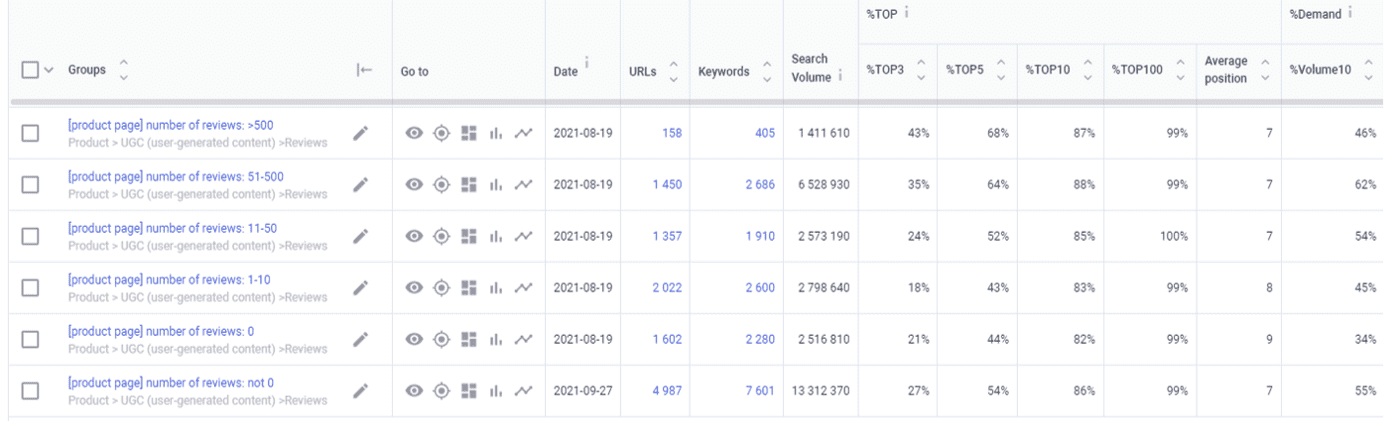
Sometimes you can have more than two groups to compare and the insights aren’t that evident on the chart, so you can always go to the table format and export all the necessary data. The pages with customers’ photos get in TOP3 twice as often as the ones without.
By the way, we check the positions of all the keywords uploaded into the project several times a week, so if needed, you’ll get information on how these groups behaved during an exact period of time, like in the picture below representing data from August to October.
If you use other services for checking your website’s positions, it will take a lot of time for you to calculate how all the segments behaved within a specific time frame.
A/B Testing
Getting back to our project. We compared two groups of pages, and I’ve already shown you how to work with the data we got. But are we 100 percent sure that this photo gallery is the only thing on the page that helps us in the rankings, or was that just a coincidence? That’s why we need to perform an experiment to prove the hypothesis. There are a lot of things that can be taken into account by the search engine, as I showed you before on the chroma-key backdrop product card. The highlighted ones in the list below are from our case:
- Photo gallery block on several pages
- External links from PCPs
- Video reviews
- 3D product images
- Number of customer reviews
- Other HTML blocks
But there are many more, like the number of customer reviews on the page. Here’s an example from another client showing how visibility depends on the customer review block. You can see on the chart that the pages with reviews are ranked higher:

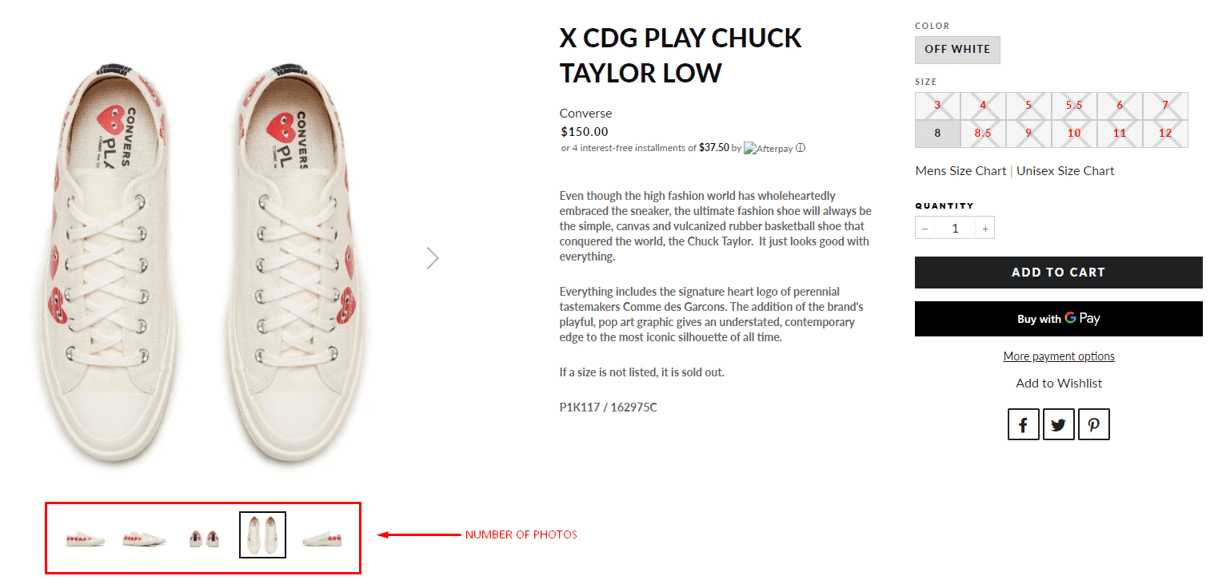
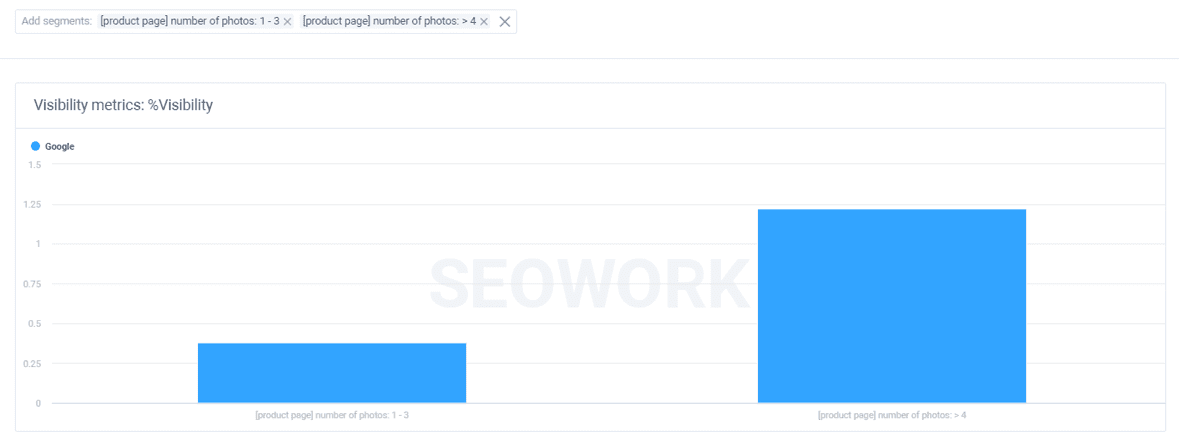
Here’s another case with a number of photos on the product pages. You can see that if there are more than four photos on the pages, their Visibility is more than two times higher.
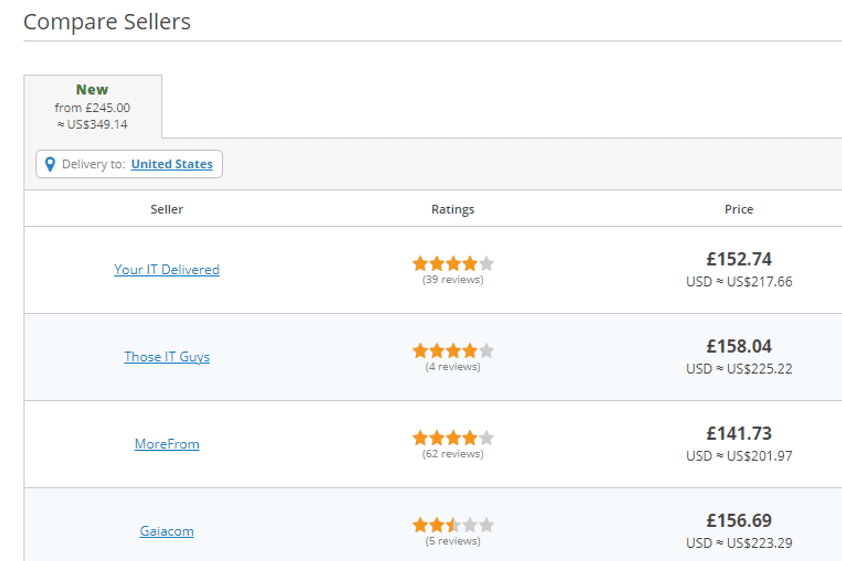
And here’s a specific HTML block with sellers of a specific product. The screen shows us that including just two sellers on the product page can potentially help you increase the product card’s presence in TOP10 for all the tracked keywords by twofold.

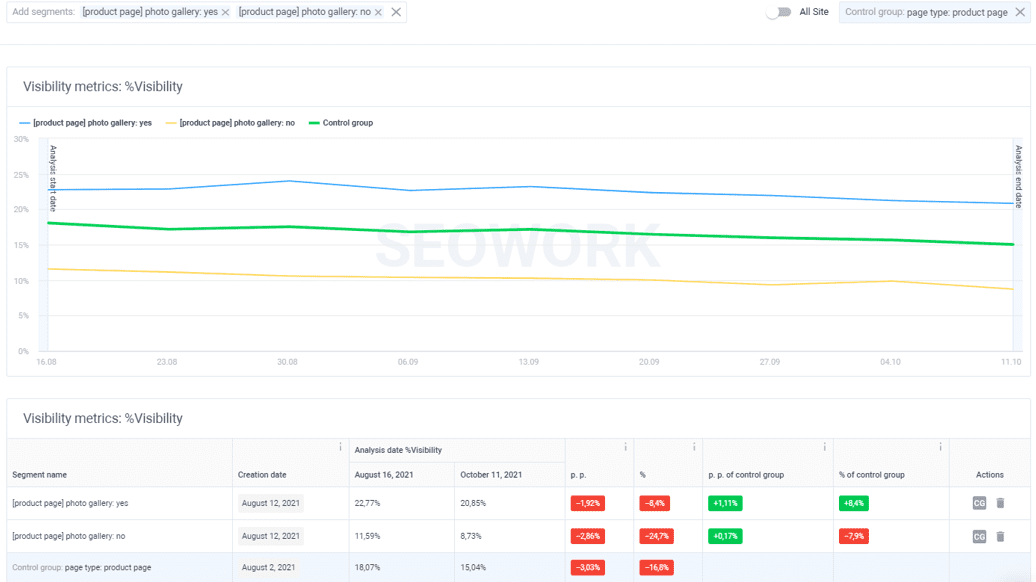
But for now, moving back to our case. Let’s start with the experiments: customer photo gallery and external links.
With our platform, you can choose any group of pages you want as a control group. Again, by a control group we mean a set of web pages that is considered to be a starting point, with no changes. How do we find out if the pages went up in the Google rankings because WE had done something to improve them, and that it wasn’t due to other factors? For this specific scenario, we took all the product card pages as the control group.
- Test group (A): Product pages with customer photo gallery implemented
- Control group (B): All product pages
Why so? For listings and product cards, different ranking factors matter. In the case of product lists, the number of products represented on the list (and its first page) is very important, and for product cards, it’s necessary to have a review block and price on the page, so it wouldn’t be appropriate to include listing pages in the control group, because it would surely affect product card page analytics.
As I mentioned before, there can be several test groups depending on what test you perform. But in our case, we just take several pages without a photo gallery block, add some photos as if they were made by customers manually, and send those pages to re-indexation.
After a while, we get the results:
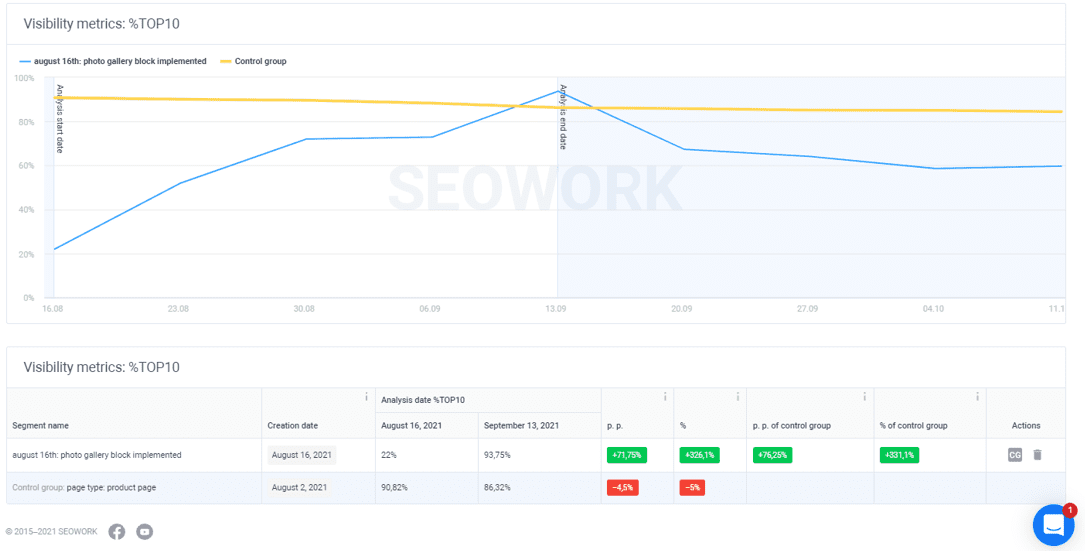
As we can see, from the moment these new pages were indexed, they’ve shown significant growth in comparison with the segment containing all the PCP pages. So now, we can say that the photo gallery block plays a role in Google’s ranking, and we can scale up the experiment in the future. In the same window, you’ll have an opportunity to evaluate how all the tested groups behaved within a chosen time frame.
Now, what about external links from product pages? The control group stays the same: all the product pages on the website.
Apparently, the results are not as clear as they were for the previous case. The client added external links to trusted resources on some pages.

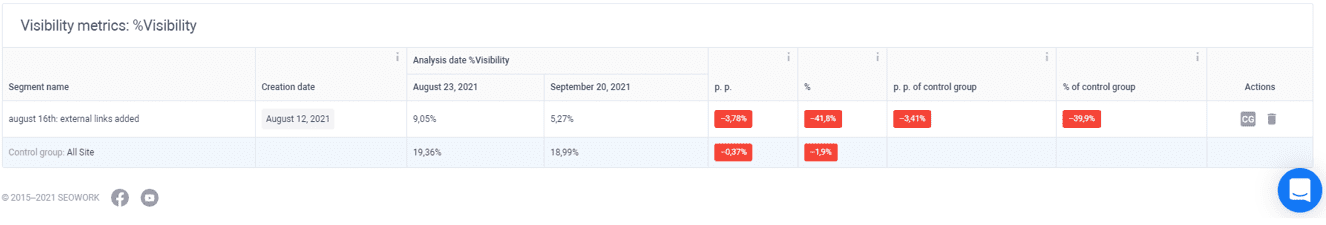
For now, I wouldn’t recommend the client spend their resources on putting additional links on pages; they should probably focus on something else. So, this hypothesis is busted.
To sum up the results: a photo gallery block should be inserted onto all the product cards, and external links should not be added.
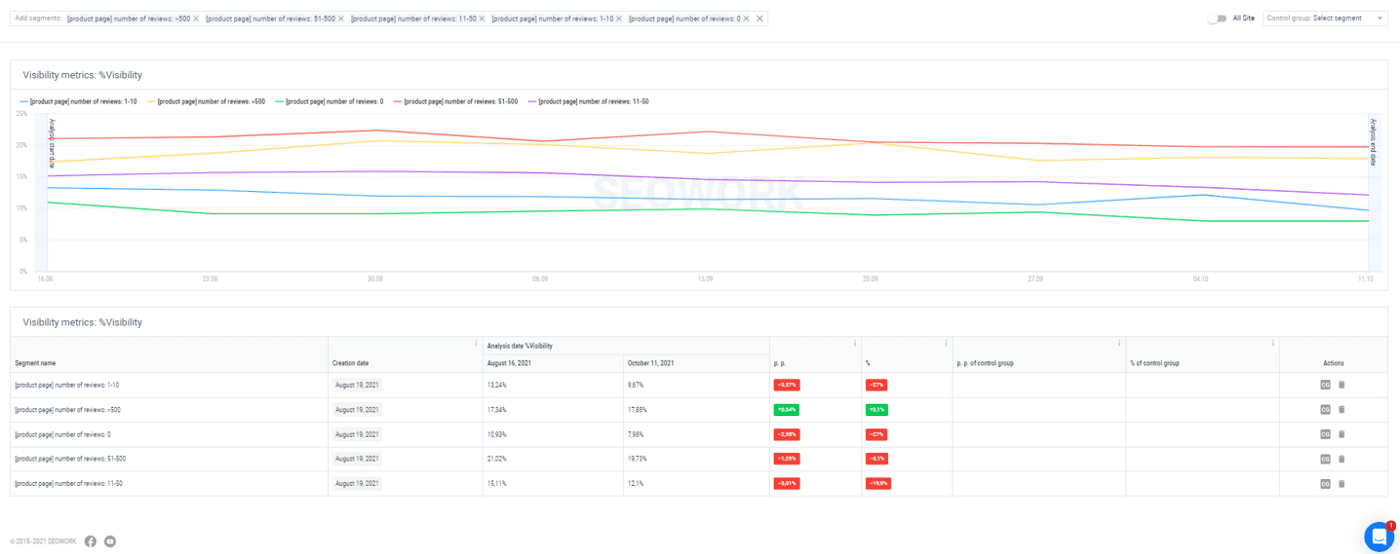
Now, let’s take a closer look at what the Segment Comparison module looks like. Again, there are two options for providing data. Here are charts for comparing several segments in the Correlations window
and the Dynamics window to measure the metrics of specific URL and keyword groups within a certain time frame.
For analytics in general, and particularly for working in the Segment Comparison module, there are usually two types of data comparison: yes/no comparison and gradation. We provide gradation of different segments for our clients’ projects by ourselves. But it always depends on you how to slice your project and what pieces of data you want to analyze.
Yes/No (presence/absence) comparison is the comparison type we used in the case I described before with the customer photo gallery. It’s quite useful for evaluating binary pieces of data like specific HTML blocks on a page or the presence/absence of content.

Gradation is more useful for those times when we work with numbers, such as numbers of product reviews, photos, or backlinks. How many referring domains for each product page do you have? How many of those backlinks are “dofollow”? What the average backlink count be for each page and at what point does getting those backlinks become unprofitable?
This screenshot represents how many URL and Keywords groups can be taken into account when it comes to analytics. Actually, there are many more segments, and you can compare all of them in the same window:
Here’s an example of how that works for reviews:
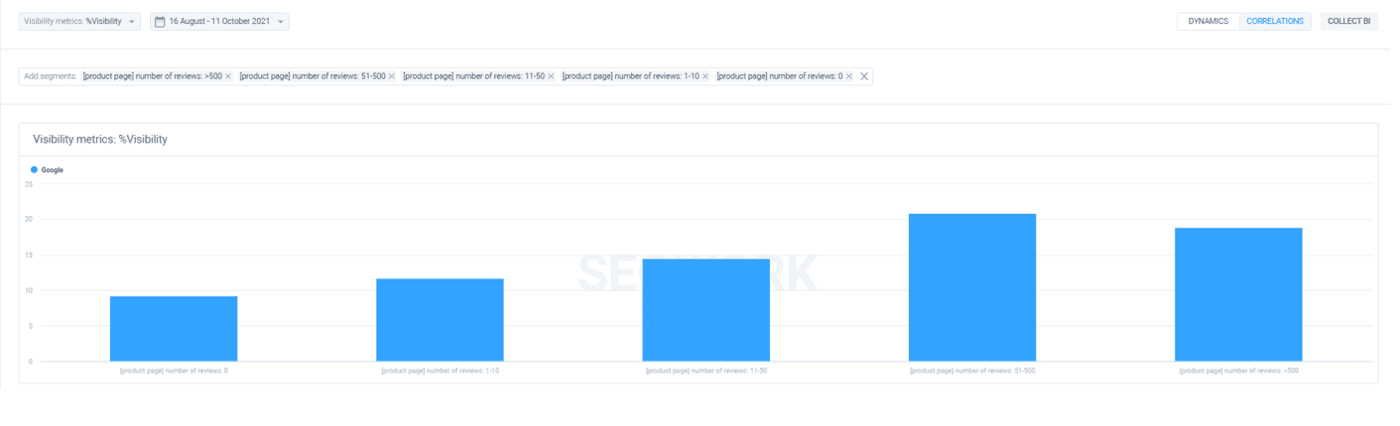
At this point, you may say that getting more than 50 reviews on a page is not as effective as if you focused on the pages with a lower review count, especially on the ones with no reviews at all. The chart says it all.
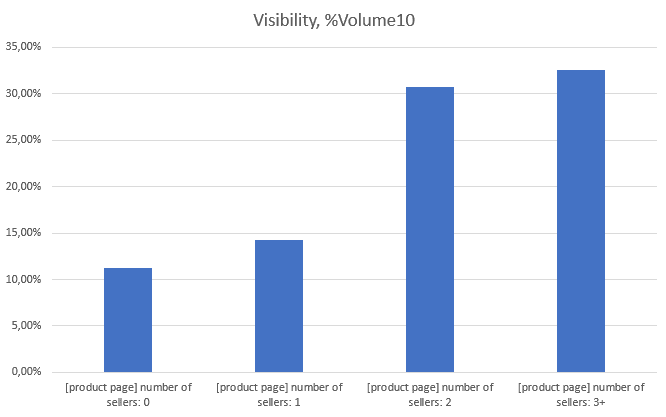
Take a look at the numbers below. The visibility of the pages with more than 50 reviews is two times higher than for the pages with no reviews at all:
And now here are some thoughts for you to remember. For sure, SEO is an experience-based field. Sometimes it may seem like you can say what’s wrong with a website just by looking at it. Perhaps you read somewhere that some approach doesn’t work, or maybe it’s your personal experience. But every hypothesis should be proven first. You shouldn’t spend time and resources on things guided by your intuition; that’s what we’re here for. Our platform is built to simplify data analytics, and the Comparison module is one of many useful tools to help you compete in the niche you work in.
Once again, here’s how to run an A/B test or SEO experiment:
- Establish a hypothesis or an idea of what you want prove and make it clear how to do it.
- Choose a set of pages for testing. Remember that the size of the test group should be statistically significant!
- Choose a control group, which usually should be all the product listings, product cards, review pages, articles, or any other type of pages you’re working with.
- Choose key metrics to be observed during your experiment; for example, if you’re working on your snippets, then CTR is a key metric.
- Evaluate the results for scaling up the experiment on all the web pages.

To sum up: just analyze different pages on your website and look for insights. Verify your ideas by conducting experiments and execute the ones with the highest impact on rankings.